
As a specialist Annual Report and Integrated Report graphic designer, I am seeing an inspiring shift by many forward-thinking not-for-profits and local government associations, away from the traditional Annual Report to a new Integrated Reporting methodology.
When comparing a traditional Annual Report to an Integrated Report, the main difference is demonstrated by how an organisation’s overall ‘value’ is expressed to the reader throughout the document.
An annual report typically focuses on financial and market data, risks, corporate structure and governance and follows a traditional report structure. However, intangible factors, including trust, reputation and viability are important value drivers and cannot be clearly communicated by the traditional annual reporting method.
Integrated Reporting is a holistic and integrated presentation of an organisation’s value creation over time. It goes beyond financial performance to include non-financial aspects such as environmental, social, and governance factors. An integrated report demonstrates how an organisation’s strategy, governance, performance, and prospects create value for various stakeholders.
Enormous benefits can be realised by shifting to an Integrated Reporting method. In additional to encouraging staff to think in an integrated way, there is a greater opportunity to more clearly express organisation strategy and value to stakeholders – not just through the presentation and measurement of financial factors. A more in-depth analysis of risks and opportunities is possible, resulting in improved processes, a better understanding of the business and improved decision-making processes.
The process starts with an ‘Integrated Thinking’ approach and a focus on communicating an organsiation’s ‘value story’. Below are a few points that I keep in mind when designing an integrated report:
- By focusing on what contributes to the organisation’s ability to create value over the short, medium, and long term, a theme for the year will emerge. This will serve as a great guide to how the design will come together and what design elements will communicate this theme to the reader.
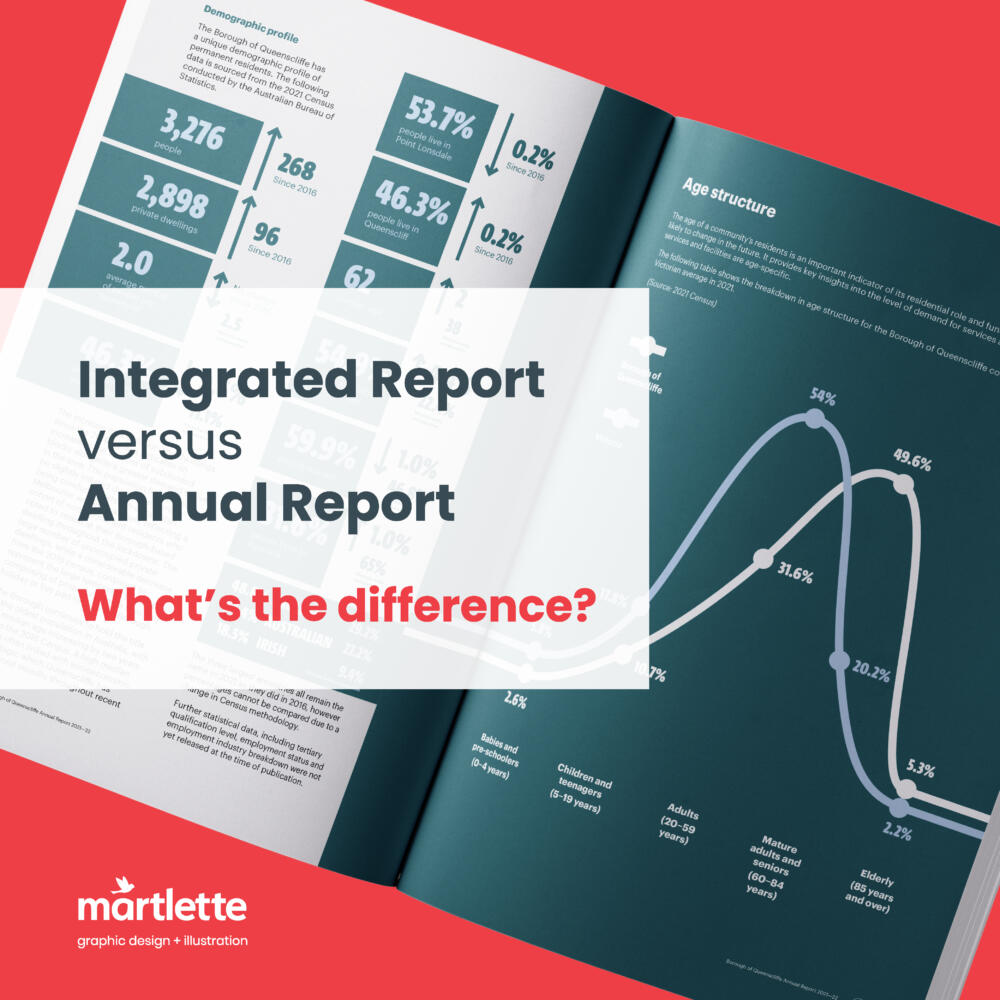
- Understanding the audience for an integrated report is a very important factor when considering how information will be presented – as with all graphic design projects. Creativity when presenting data and content is a great way to reach out to the reader through cleverly designed graphics and charts.
- Visual connectivity between sections of the integrated report can effectively emphasise the interrelationships and dependencies between financial, environmental, social, and governance aspects. Connecting the dots between different areas can present a holistic picture to the reader.
- A concise and easily understandable report makes use of clear and plain language to communicate complex concepts. This includes design elements throughout the report. Presenting content as visual elements such as charts and infographics, will enhance readability and comprehension.
- Ensuring that the report is easily accessible to a wide range of stakeholders is vital. Publishing the report in print and digital formats will allow for easy navigation and searchability.
If your organisation is thinking about making the move to an well designed integrated report, get in touch or browse some of my latest annual report and integrated report design projects here.