
Annual Reports are often a huge yearly task that involves collecting information, facts and figures from all sections of your organisation and then somehow merging this all into one text heavy document that may or may not be used as part of our marketing collateral.
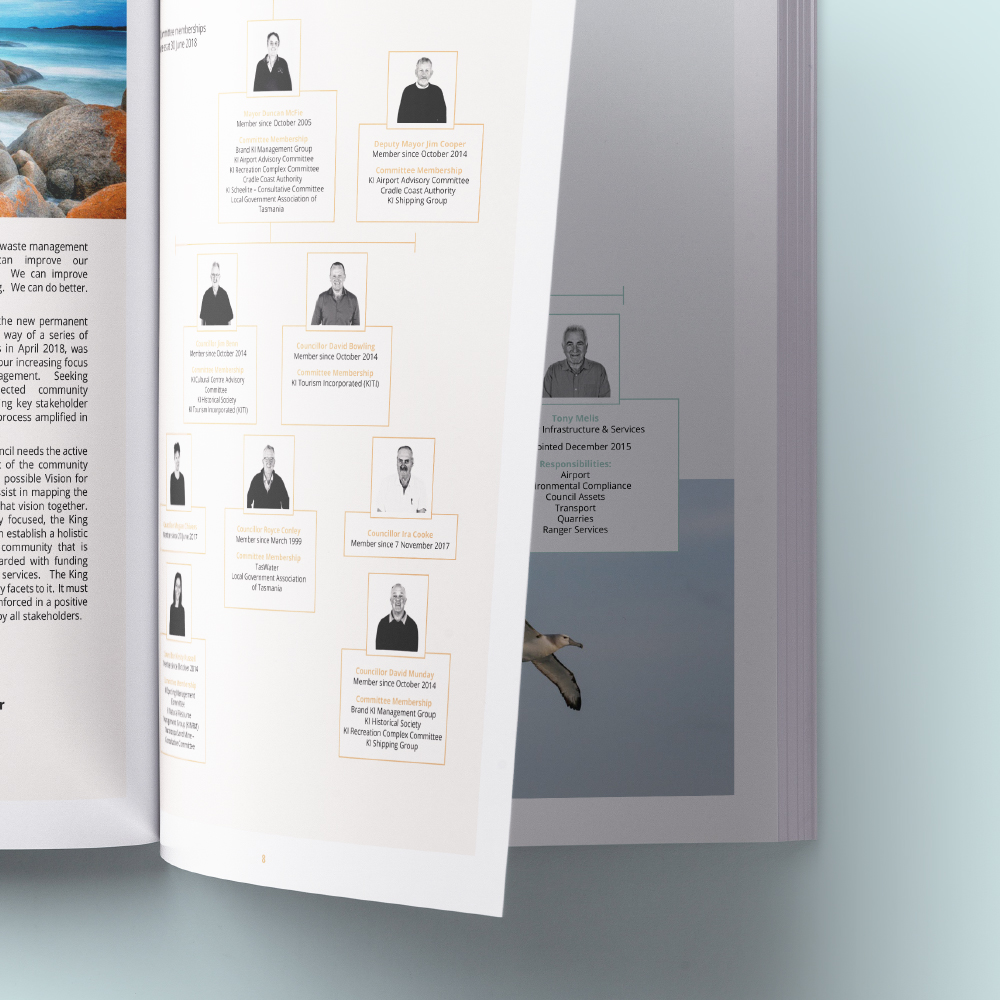
King Island Council’s Annual Report design is a great example of this!
Forward thinking organisations are changing the way they look at their Annual Report for the better, putting it to work as an impactful marketing asset that cleverly communicates with key stakeholders through authentic story telling and an elevated design approach.
Here are three simple steps to ensuring that your Annual Report works hard for you throughout the year and captures ‘the year that was’ with meaning and clarity.
Step 1: It was a year of …
Get your team together and take a detailed look at the past 12 months for your organisation. Discuss some of the year’s main events, achievements and milestones that really characterise the year as one body of work. Then ask yourself, is there a theme emerging that captures all of what you discussed?
For example, your organisation may have organised some very well attended events throughout the year, that increased your audience profile within the environmental protection community. As a result your team has been able to make important changes to the way business is carried out, while making a positive impact on your local environment. This may have lead to improved workplace culture, increased social media engagement, and important strategic goals reached for your organisation.
In the above example, this organisation may decide that their Annual Report should tell the story of their environmental protection endeavours during the past year.
The theme of your Annual Report is communicated via various elements and need not just be a story about “what happened this year”. Your theme is communicated through a selection of colours, typography, section headings, content layout, photography and how key facts and figures will be presented (including charts, infographics and diagrams).
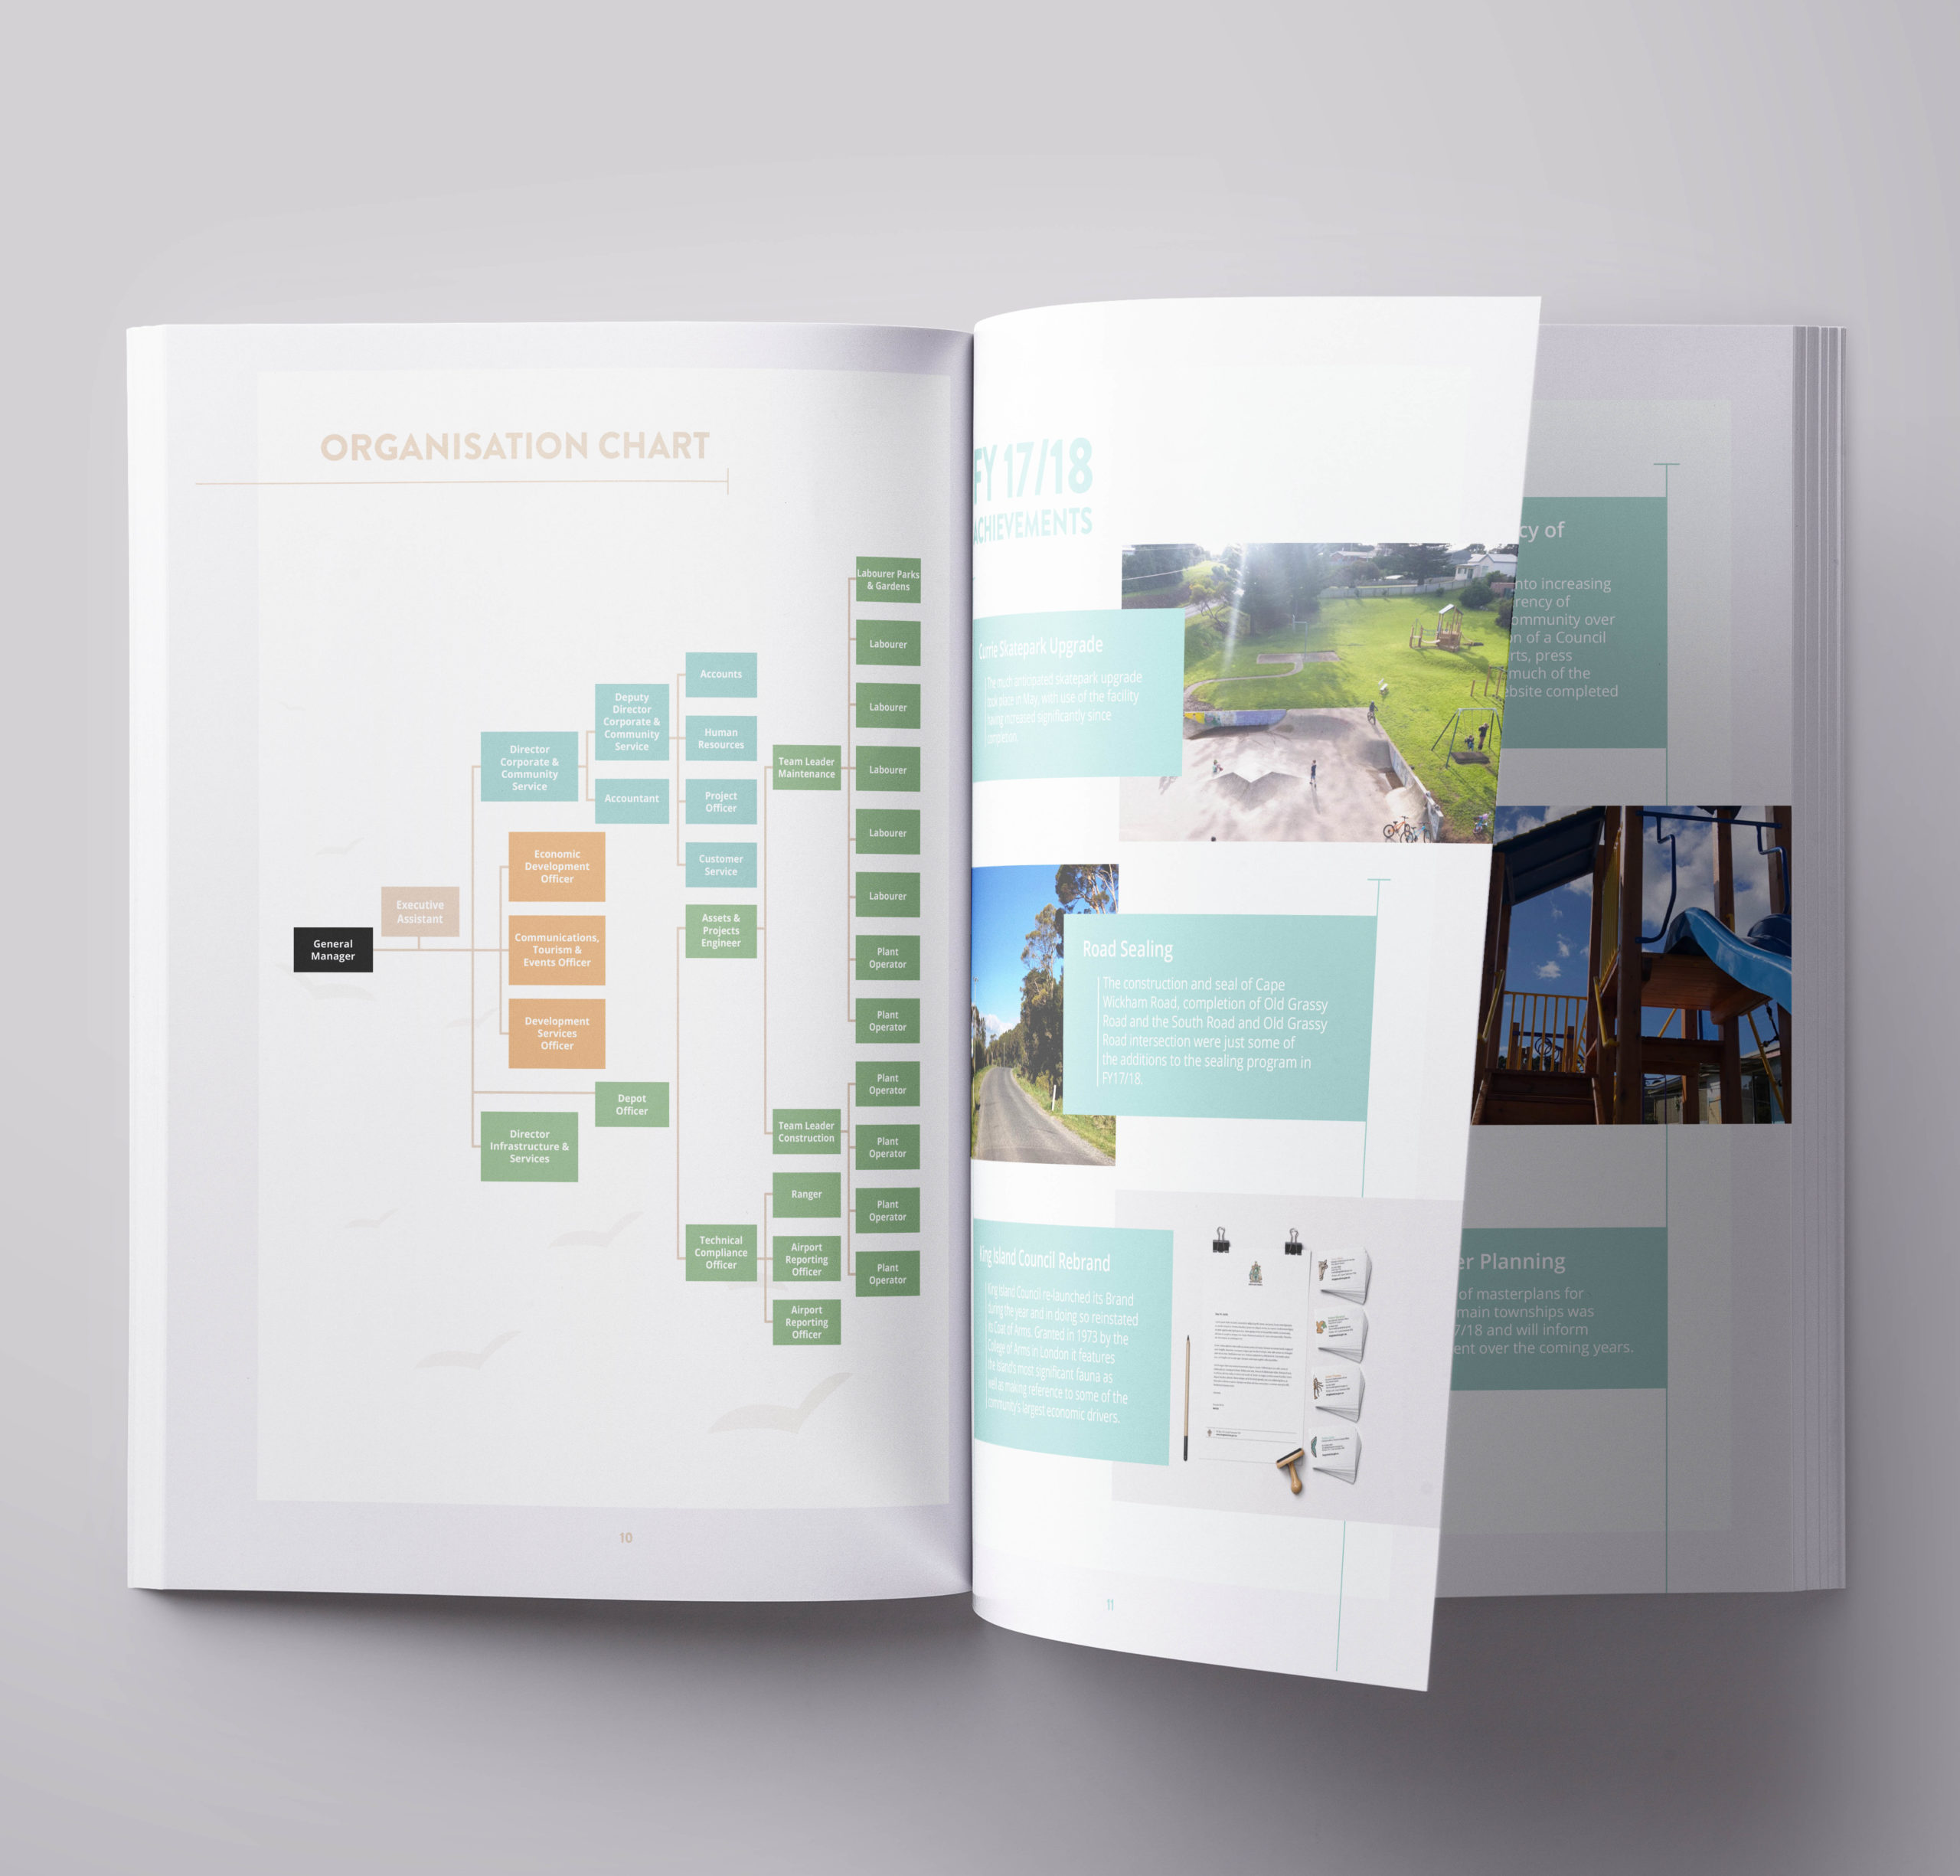
Below is an example from a Martlette client, King Island Council, who wanted their Annual Report to reflect upon their continued commitment to protecting and promoting the unique natural landscape of the Island to stakeholders and visitors.
Step 2. Structure is everything
If you are the person responsible for collecting the raw data and written content from other team members, your job will be much easier if you have already decided on your Annual Report structure at the start.
The structure will mostly likely be reflected in your contents page, giving you an idea of how your story will unfold for the reader.
Some organisations have a legal requirement to present particular information in their Annual Report and while this may increase what you need to include, it doesn’t mean it has to be boring in its presentation. This is where your graphic designer gets creative and looks at imaginative ways to communicate your information.
I good example of structure might be:
- Welcome
- Intro from CEO/Chairperson
- Who we are – a section that focuses on telling the reader more about your vision and core values
- What we do – what is your mission and what strategic priorities do you have in place to achieve your mission.
- How we do it – outline your how your strategic planning has guided your actions
- Our year – what were your highlights, challenges and achievements for the year?
- Financials – this is where you would include income and expenditure statements
- Organisation partners – you may like to end your report with a special acknowledgement to your sponsors, supporters and partners.
Having your structure as your guide, will help you not only plan the written content for your report, but will give you an idea of what photography may be needed for each section and whether there are sections worth highlighting, to communicate your theme throughout the report.
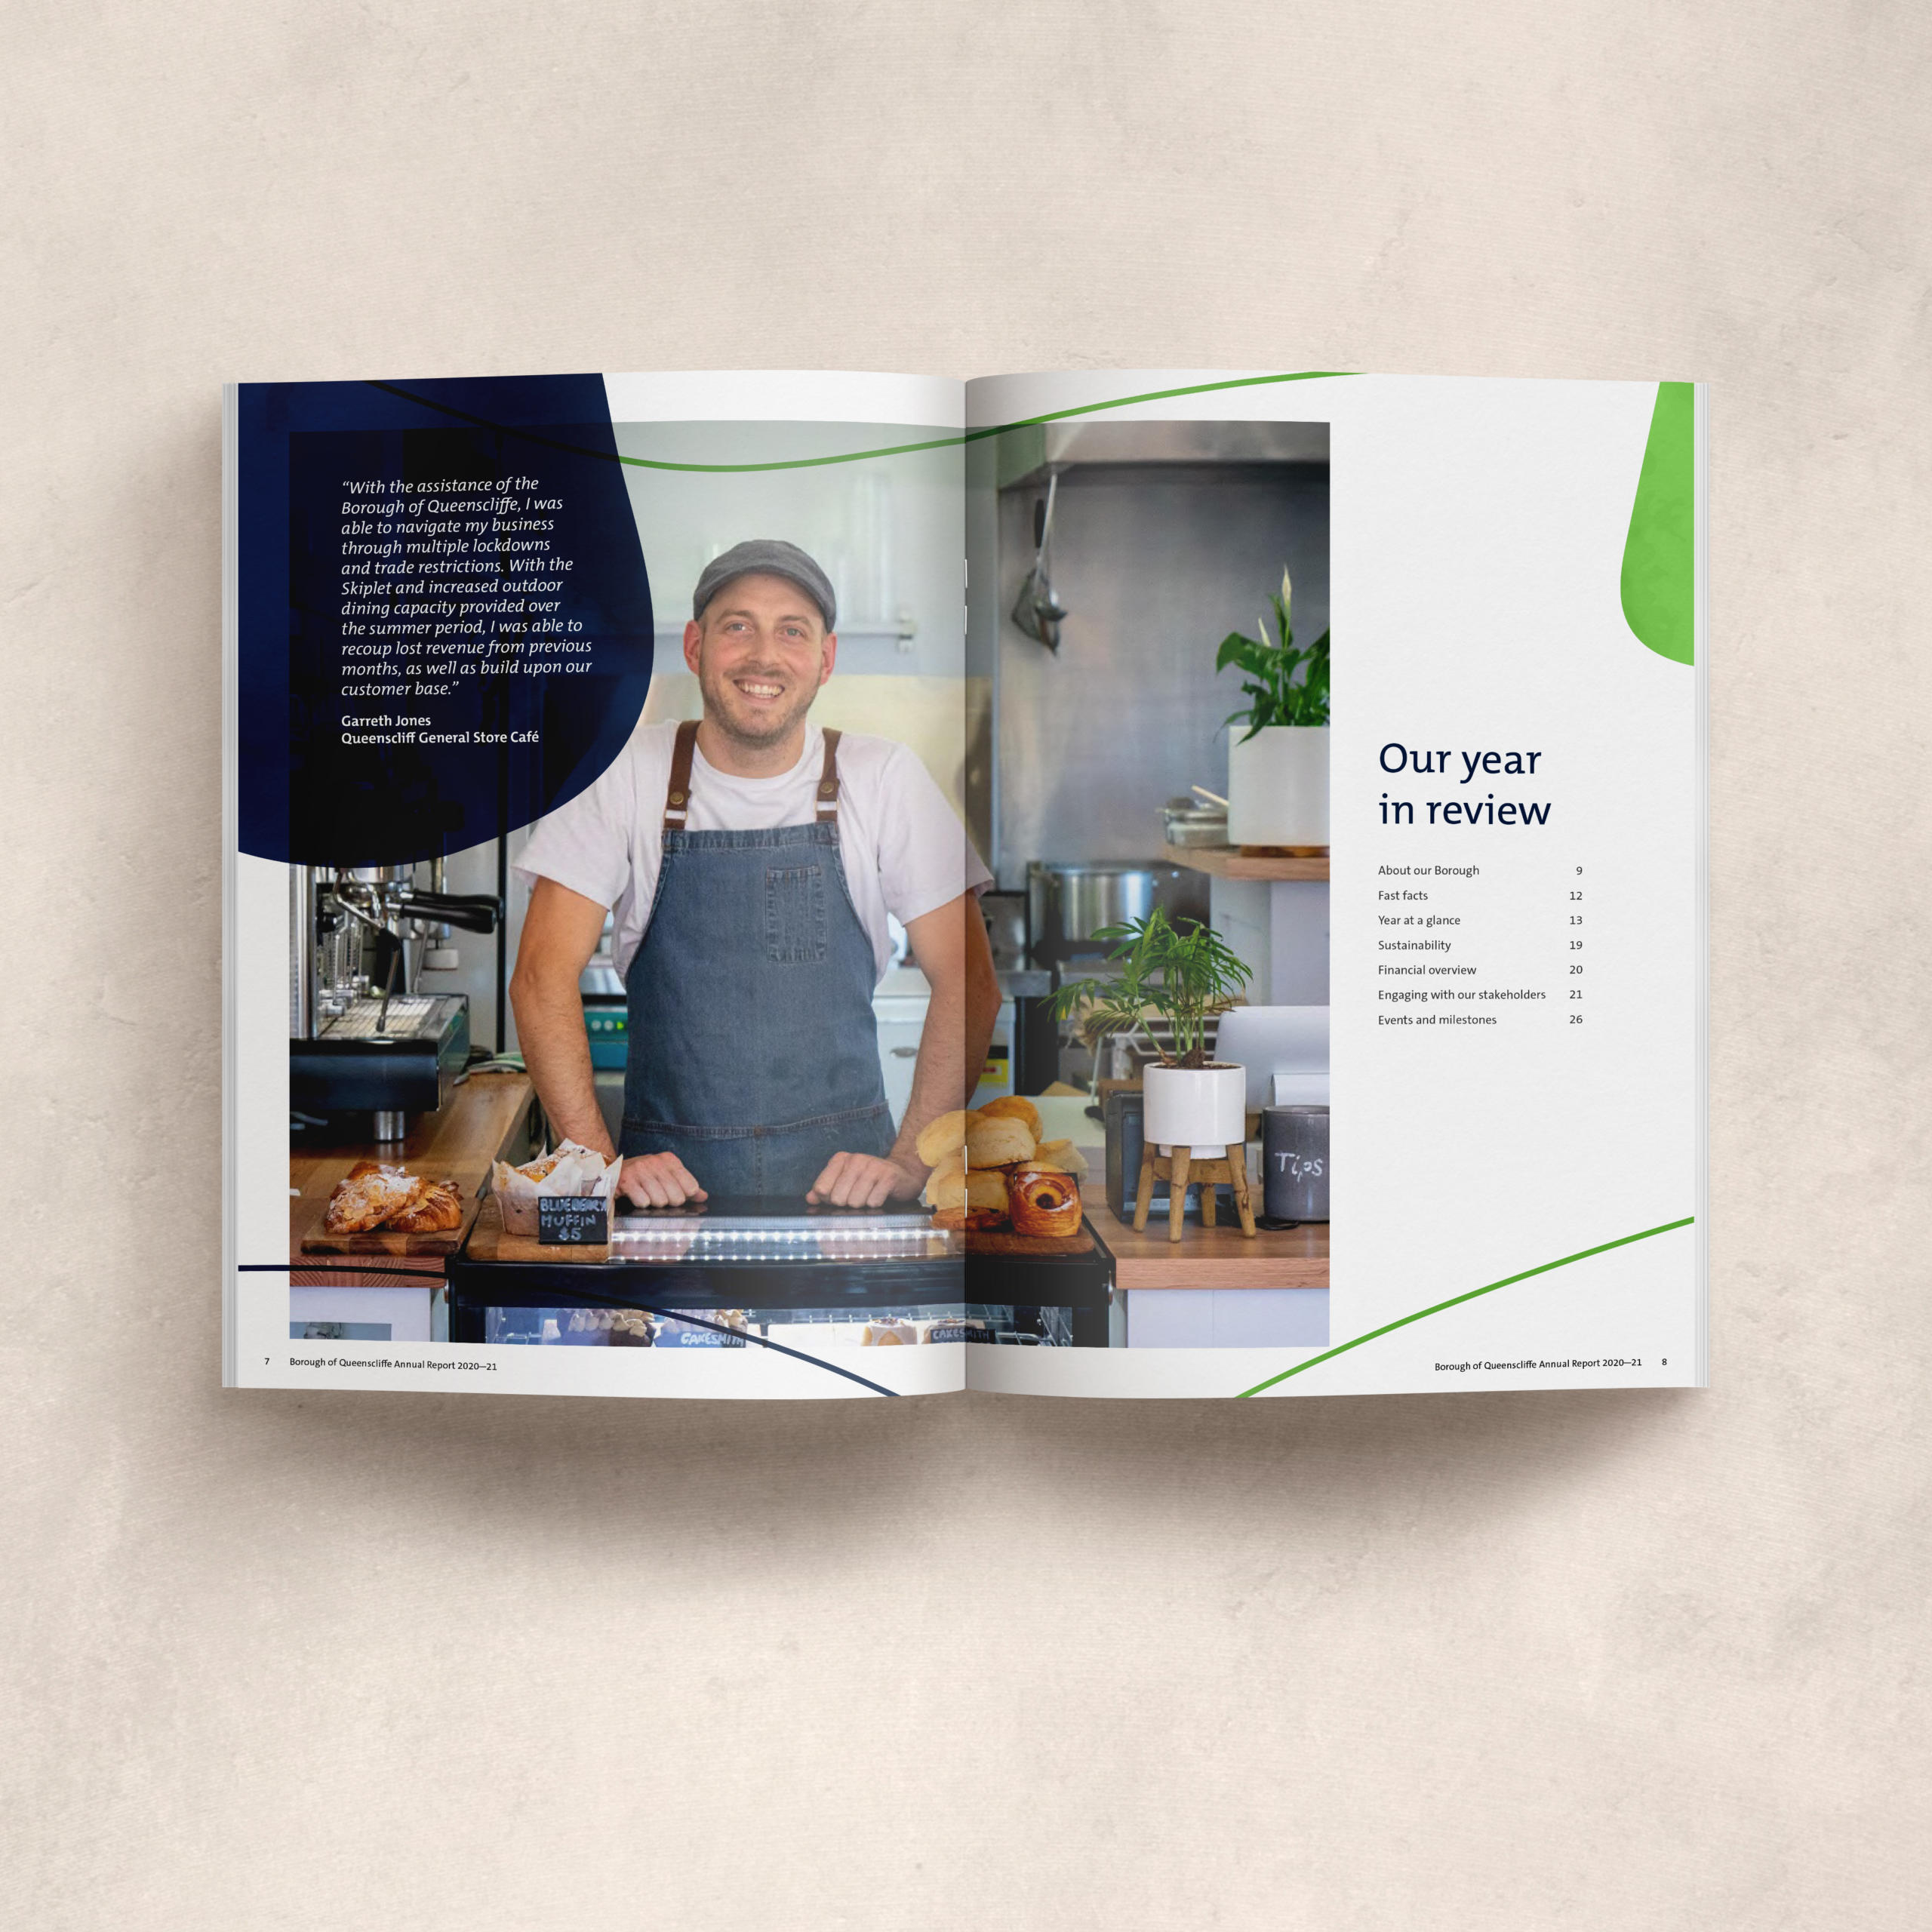
Here’s example of one of my favourite Annual Reports from the Borough of Queenscliffe, where the Annual Report process always begins with its structure
Step 3. Print or digital…. Or both?
The decision to print your Annual Report will depend largely on your audience and how they prefer to consume information. Printing will be important if your organisation has a legislative requirement to table your Annual Report with government or if you have promised printed copies to your stakeholders and sponsors in recognition of their support.
If your target audience is likely to read you Annual Report from front to back, then printing it will also give them the opportunity to read it without having to be in front of a computer or mobile device. Your designer will also be able to explore opportunities to communicate your them through a custom selection of paper stock and printing processes. From luxe gloss finishes to environmentally sustainable paper and inks – the opportunities for printed presentation are limitless.
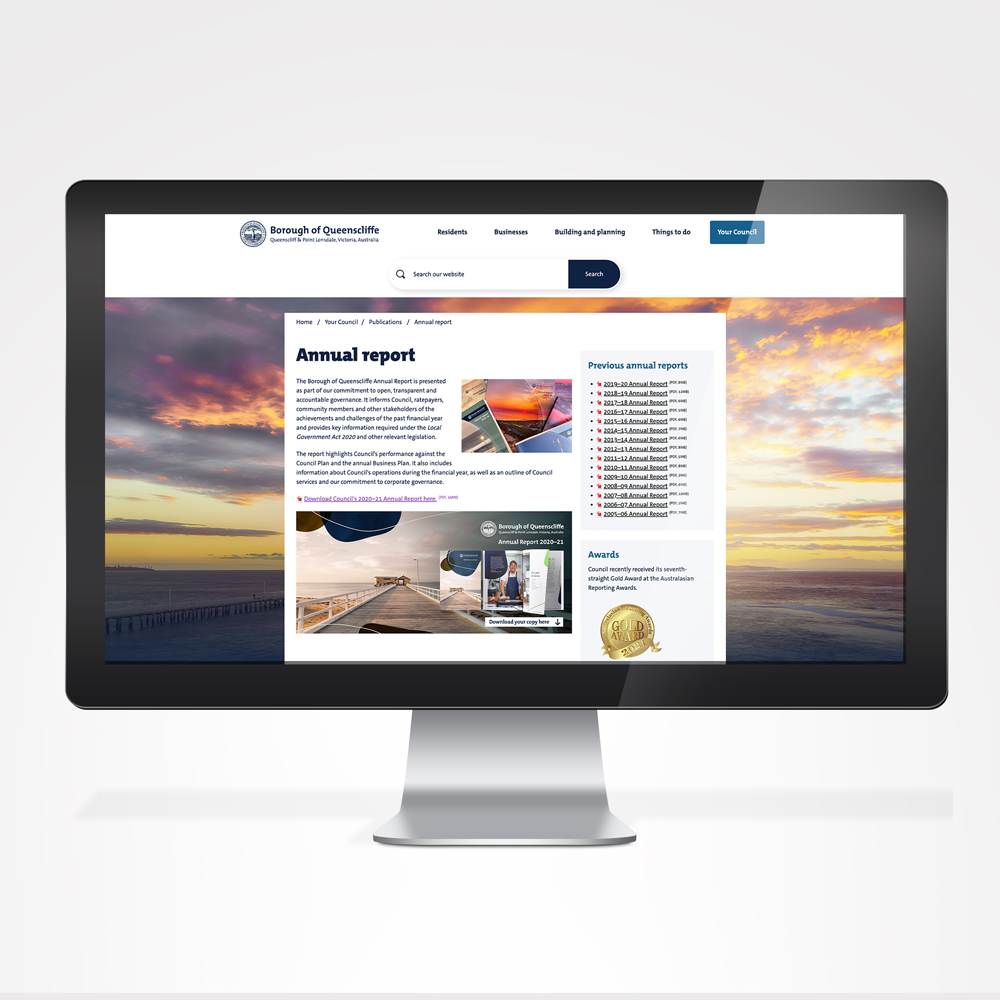
Even if you are printing your Annual Report you may also upload a digital to your organisation’s website for online reading and greater accessibility to a wider reader audience. Sharing your Annual Report throughout the coming year and promoting it, becomes so much easier once it is available online.
The Martlette Signature Annual Report Design Experience
Martlette is an award winning Annual Report design specialist. Located in Geelong, in regional Victoria, only a short drive from Melbourne, Martlette works with clients big and small, across Australia. The Martlette Signature Annual Report Design Experience ensures that your unique brand story is told and speaks to your successes.
Read more about the Martlette Signature Annual Report Design Experience and find out my expertise can benefit your next Annual Report process.